2018/12/06(木) [n年前の日記]
#1 [python] Pythonでwavファイルに対して何か処理その2
Python + Pydub で wavファイルを読み込んで分割するところまではできたけど、その分割したデータをどうやって TIC-80用に加工するか、というところで悩んでいたり。
◎ フーリエ解析。 :
とりあえず、以下を参考にしてフーリエ解析とやらをするところまではできたのだけど。環境は Windows10 x64 ; Python 2.7.15 + Pydub 0.23.0 + Numpy 1.15.4。
_高速フーリエ変換(FFT) - 人工知能に関する断創録
_fft_test.py
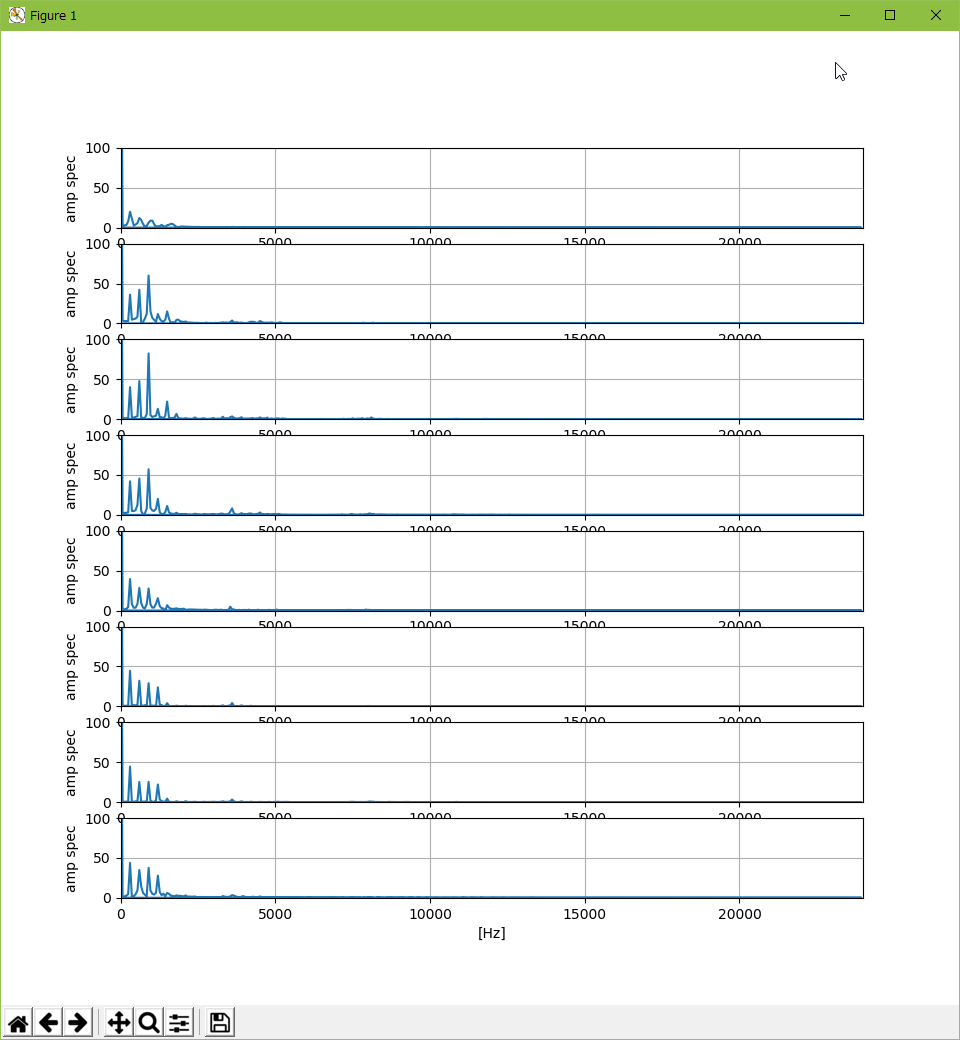
しかし、これができても…。任意の周波数が複数鳴らせるサウンド仕様だったら使い道があるかもしれんけど、TIC-80はそういうサウンド仕様じゃないし…。
_高速フーリエ変換(FFT) - 人工知能に関する断創録
_fft_test.py
import os
import sys
from pydub import AudioSegment
# from pydub.playback import play
import numpy as np
import matplotlib.pyplot as plt

draw_wave_enable = 0
window_enable = 0


def fft(dt, rate):
    """FFT."""
    specs = []
    freqlists = []
    ampspecs = []
    phasespecs = []

    for d in dt:
        n = len(d)

        if window_enable:
            # use Hamming window
            wdw = np.hamming(n)  # Hamming Window
            windowedData = wdw * d
            spec = np.fft.fft(windowedData)  # FFT
        else:
            # not use window
            spec = np.fft.fft(d)  # FFT

        freqlist = np.fft.fftfreq(n, d=1.0 / rate)
        ampspec = [np.sqrt(c.real ** 2 + c.imag ** 2) for c in spec]
        phasespec = [np.arctan2(int(c.imag), int(c.real)) for c in spec]

        specs.append(spec)
        freqlists.append(freqlist)
        ampspecs.append(ampspec)
        phasespecs.append(phasespec)

    return specs, freqlists, ampspecs, phasespecs


def draw_fft(ampspecs, freqlists, rate, iadd):
    """Draw FFT."""
    row = 8
    for i in range(row):
        plt.subplot(row, 1, i + 1)
        plt.plot(freqlists[iadd + i], ampspecs[iadd + i])
        plt.axis([0, rate / 2, 0, 100])
        plt.xlabel("[Hz]")
        plt.ylabel("amp spec")
        plt.grid()
    plt.show()


def draw_wave(dt, iadd):
    row = 8
    for i in range(row):
        plt.subplot(row, 1, i + 1)
        plt.plot(dt[iadd + i])
        plt.ylim(ymax=1.0)
        plt.grid()
    plt.show()


def main():
    """Main."""
    if len(sys.argv) != 2:
        print("Usage: python %s WAV_filename" % os.path.basename(__file__))
        sys.exit()

    infile = sys.argv[1]
    sound = AudioSegment.from_wav(infile)  # read wave file
    # play(sound)

    data = np.array(sound.get_array_of_samples())
    x = data[::sound.channels]  # get mono channel

    # normlize
    x = (x - x.min()).astype(float) / (x.max() - x.min()).astype(float)

    rate = sound.frame_rate
    sample_len = len(x)
    frm = rate / 60
    n = sample_len / frm

    print("-- Input file : %s" % infile)
    print("-- Channel : %d" % sound.channels)
    print("-- Sampling rate : %d Hz" % rate)
    print("-- Duration : %f msec" % len(sound))
    print("-- Sample length : %d point" % sample_len)
    print("-- 1 Frame length : %d point" % frm)
    print("-- n : %d" % n)

    # divide
    dt = []
    for i in range(0, sample_len, frm):
        dt.append(x[i:i + frm])

    if draw_wave_enable:
        # draw wave
        draw_wave(dt, 0)
    else:
        # FFT
        specs, freqlists, ampspecs, phasespecs = fft(dt, rate)
        draw_fft(ampspecs, freqlists, rate, 0)


if __name__ == "__main__":
    main()
> python fft_test.py hello.wav
-- Input file : hello.wav
-- Channel : 1
-- Sampling rate : 48000 Hz
-- Duration : 511.000000 msec
-- Sample length : 24514 point
-- 1 Frame length : 800 point
-- n : 30
しかし、これができても…。任意の周波数が複数鳴らせるサウンド仕様だったら使い道があるかもしれんけど、TIC-80はそういうサウンド仕様じゃないし…。
◎ 一定個数でデータを抜き出してみたり。 :
とりあえず、1/60秒単位で分割したwavデータから、TIC-80 の波形メモリのスペックに合わせて32ポイントずつデータを取り出して、その32ポイントのデータを元の長さに並べ直してから鳴らしてみたり。
_divide_composite.py
しかし…これはちょっと聞けたものじゃない…。
_hello_9600hz.wav
_hello_9600hz_output.wav
_crt_ooo_13440hz.wav
_crt_ooo_13440hz_output.wav
最初は、32個 x n個のデータを全部加算してから n で割って波形を求めてたけど、それだと聞けたものじゃなく。単に一ヶ所取り出しただけのほうがまだマシかもしれないなと…。しかしそれでも、この状態…。
以下は、元波形、加工後波形、元波形、加工後波形…の順で並べたもの。
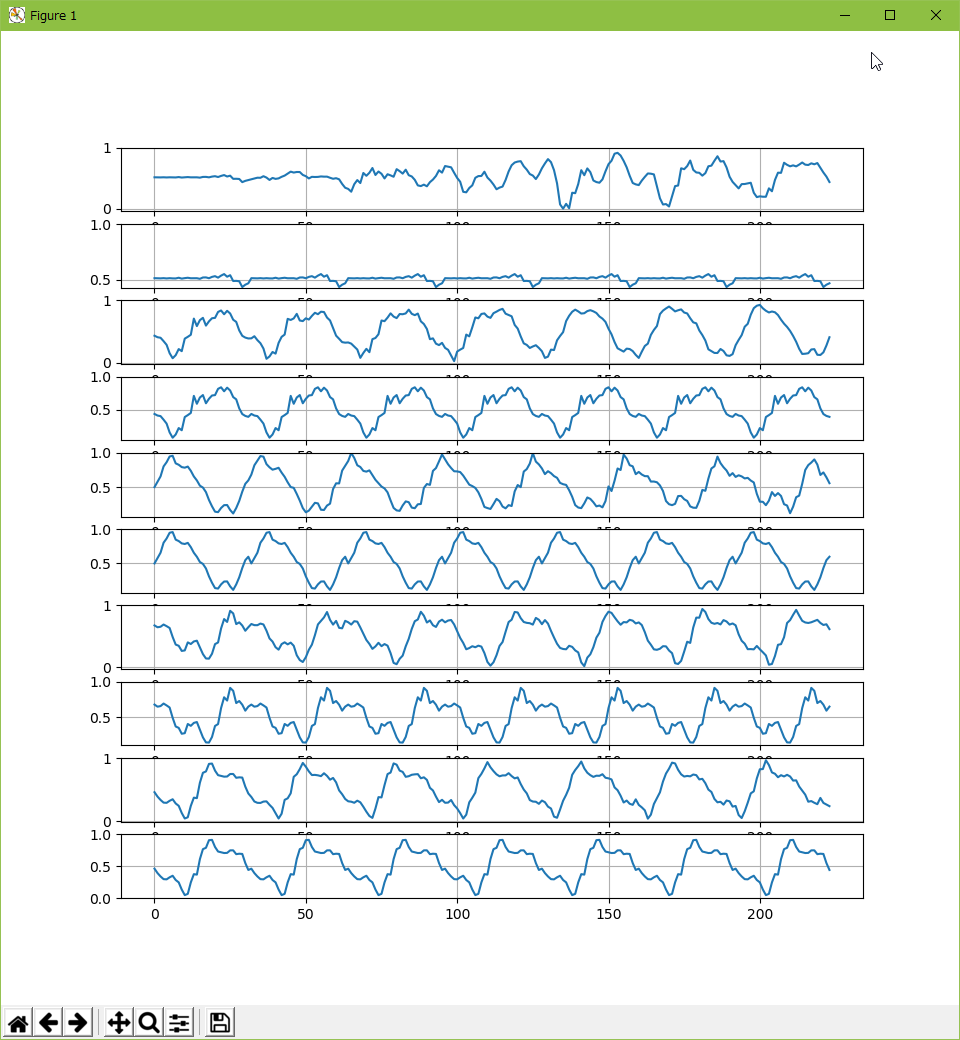
こうして見ると、波形はそんなに違っていない…とも言えないか。結構違うな…。何にせよ、この方法ではそれらしい音にならないな…。
_divide_composite.py
import os
import sys
from pydub import AudioSegment
from pydub.playback import play
import numpy as np
import matplotlib.pyplot as plt

ave_enable = 0
draw_wave_enable = 0
play_sound = 1
print_table = 0
export_wav = 1


def draw_wave(dt):
    row = 8
    for i in range(row):
        plt.subplot(row, 1, i + 1)
        plt.plot(dt[i])
        plt.grid()
    plt.show()


def composie(dt):
    ndt = []
    nwave = []
    for src in dt:
        n = len(src) / 32
        nd = np.array([0.0] * 32)
        nn = 0

        if ave_enable:
            # get average value
            for i in range(0, len(src), 32):
                for j in range(32):
                    if i + j < len(src):
                        nd[j] += src[i + j]
                nn += 1
            nd = nd / nn
        else:
            # get 32point data only
            for j in range(32):
                if j < len(src):
                    nd[j] += src[j]
            nd[0] = 0.50 * nd[0] + 0.50 * src[32]
            nd[1] = 0.75 * nd[1] + 0.25 * src[33]
            # nd[0] = 0.25 * nd[0] + 0.75 * src[32]
            # nd[1] = 0.50 * nd[1] + 0.50 * src[33]
            # nd[2] = 0.75 * nd[2] + 0.25 * src[34]
            nn += 1

        ndt.append(nd)

        dd = np.array([])
        for i in range(n):
            dd = np.append(dd, nd)
        nwave.append(dd)
    return ndt, nwave


def get_sound_from_numpy_arrays(dt, rate):
    dt = dt.astype("int16")
    # print("min = %f , max = %f" % (dt.min(), dt.max()))
    sound = AudioSegment(
        dt.tobytes(),
        sample_width=2,  # 2 byte (16 bit) samples
        frame_rate=rate,  # sampling rate
        channels=1  # mono
    )
    return sound


def main():
    """Main."""
    if len(sys.argv) != 2:
        print("Usage: python %s WAV_filename" % os.path.basename(__file__))
        sys.exit()

    infile = sys.argv[1]
    sound = AudioSegment.from_wav(infile)  # read wave file

    data = np.array(sound.get_array_of_samples())
    src = data[::sound.channels]  # get mono channel

    # normlize
    src = (src - src.min()).astype(float) / (src.max() - src.min()).astype(float)

    rate = sound.frame_rate
    frm = rate / 60
    sample_len = len(src)

    print("-- Input file : %s" % infile)
    print("-- Channel : %d" % sound.channels)
    print("-- Sampling rate : %d Hz" % rate)
    print("-- 1 Frame length : %f point" % frm)
    print("-- Duration : %f msec" % len(sound))
    print("-- Sample length : %f point" % sample_len)
    print("-- n : %d" % (sample_len / frm))

    # divide
    dt = []
    for i in range(0, sample_len, frm):
        dt.append(src[i:i + frm])

    ndt, nwave = composie(dt)

    # draw graph
    if draw_wave_enable:
        iadd = 0
        row = 10
        for i in range(0, row, 2):
            plt.subplot(row, 1, i + 1)
            plt.plot(dt[iadd + (i / 2)])
            plt.ylim(ymax=1.0)
            plt.grid()
            plt.subplot(row, 1, i + 2)
            plt.plot(nwave[iadd + (i / 2)])
            plt.ylim(ymax=1.0)
            plt.grid()
        plt.show()

    nw = np.array([])
    for d in nwave:
        nw = np.append(nw, d)

    org_src = (src - 0.5) * 0x0ffff
    org_sound = get_sound_from_numpy_arrays(org_src, rate)

    nww = ((nw - 0.5) * 0x0f).astype("int16") * 0x0fff
    new_sound = get_sound_from_numpy_arrays(nww, rate)

    if play_sound:
        # play(sound)
        play(org_sound)
        play(new_sound)

    if export_wav:
        fn = "_output.wav"
        new_sound.export(fn, format="wav")
        print("-- output : %s" % fn)

    if print_table:
        print("tbl={")
        for src in ndt:
            d = (src * 0x0f).astype("int16")
            # print("min,max=%d,%d" % (d.min(), d.max()))
            # print(d)
            s = " {"
            for i in range(0, 32, 2):
                v = ((d[i + 1] & 0x0f) << 4) | (d[i] & 0x0f)
                if i < 30:
                    s += "0x%02x," % v
                else:
                    s += "0x%02x" % v
            s += "},"
            print(s)
        print("}")


if __name__ == "__main__":
    main()
しかし…これはちょっと聞けたものじゃない…。
_hello_9600hz.wav
_hello_9600hz_output.wav
_crt_ooo_13440hz.wav
_crt_ooo_13440hz_output.wav
最初は、32個 x n個のデータを全部加算してから n で割って波形を求めてたけど、それだと聞けたものじゃなく。単に一ヶ所取り出しただけのほうがまだマシかもしれないなと…。しかしそれでも、この状態…。
以下は、元波形、加工後波形、元波形、加工後波形…の順で並べたもの。
こうして見ると、波形はそんなに違っていない…とも言えないか。結構違うな…。何にせよ、この方法ではそれらしい音にならないな…。
[ ツッコむ ]
以上です。